Image 1: histogram of ccd frame "m51"
This can not be done by a ccd camera automatically. Therefore we get an image with the "real" contrasts and grey levels from our camera. This means, that we can either show the centre region of a galaxy (or a comet) or the outer region with the lower intensity. If we take a look at the intensity of such an image, we find the following curve:
Image 1: histogram of ccd frame "m51"
On the horizontal axis the pixel values are shown while the vertical axis (frequency) gives a count of how often the according value appears in the image. The ccd image "m51" consists of many pixels with values with a value close to 1000 and very few pixels with higher values. But accidently the galaxy's core belongs to the "high" level pixels. Image 2 is the ccd image itself. The curve in the image shows the pixel values along a line through the centre of the galaxy.
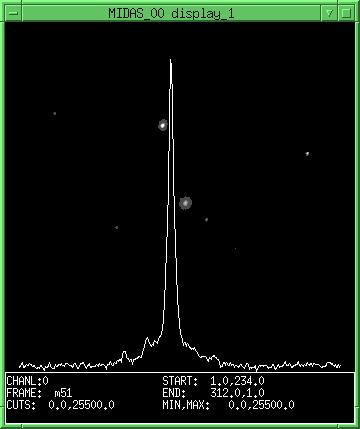
Image 2: the ccd frame "m51"
The logarithmic scaling then compresses the image so that the pixel values are closer to each other (not the amount of pixels, only the grey levels!). The image 3 and 4 show the logarithmically scaled version of images 1 and 2.

Image 3: histogram of the logarithmic scaled frame "m51l"
If you take a look at the outcoming image frame you will see a lot more detail of the galaxy while you can still see the centre region as a bright spot. Right of the galaxy you can even spot a trail of a satellite which flew through the area while the image was taken. The curve in the image again shows the pixel values along the same line as in image 2. This time the difference between dark and light pixels has been dramatically decreased.
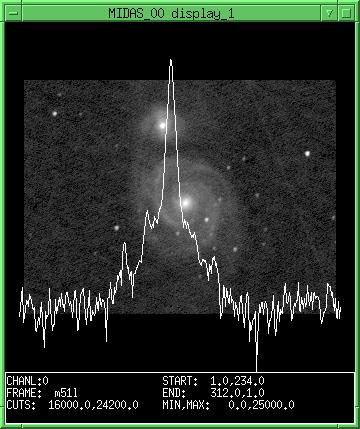
Image 4: the lograrithmically scaled ccd frame "m51l"
For further information on how to use the logarithmic scaling with your software, please refer to the manual. Any software will be a bit different, but they will all do the same math:
RESULTING_IMAGE = LOG (INPUT_IMAGE) * SCALING_FACTORYou will only have to input the minimum and maximum value of the original image to define the range on which the logarithmic scaling is applied. In MIDAS this is done by setting the CUT values of the input image, SBIG's CCDOPS uses the background value and the range value, your software uses... But still - the calculated image will be the same.
The images have been created using an ST5 camera with SBIG's CCDOPS software under DOS. The visualisation and scaling has been done by using MIDAS from the European Southern Observatory running a LINUX version. MIDAS is available for many UNIX versions via ftp (I hope the ftp address is still valid?!)...